Today many of our customers have large databases, and today I would consider a database…
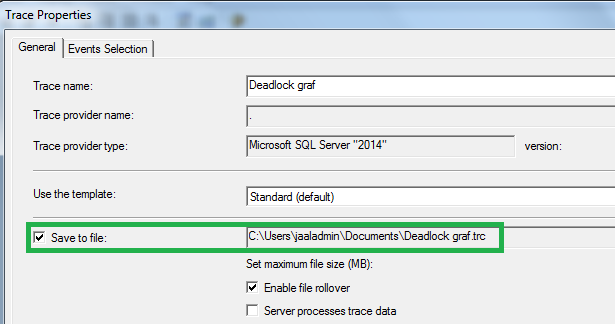
Start SQL Server Profiler trace General – saving the file to disk
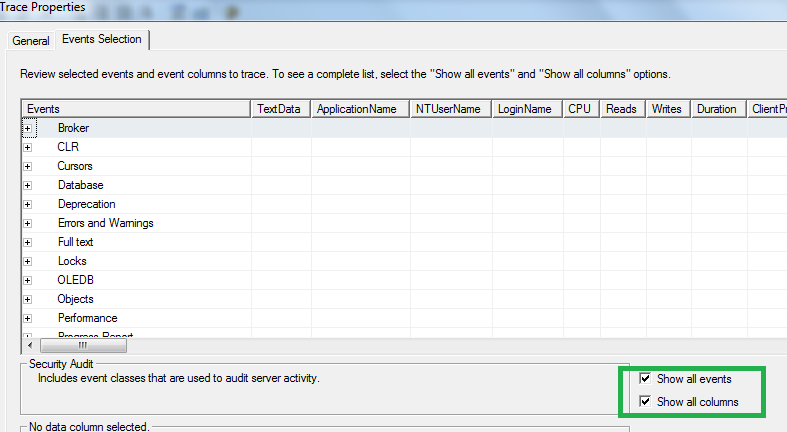
Events Selection – select Show all events & Show all columns
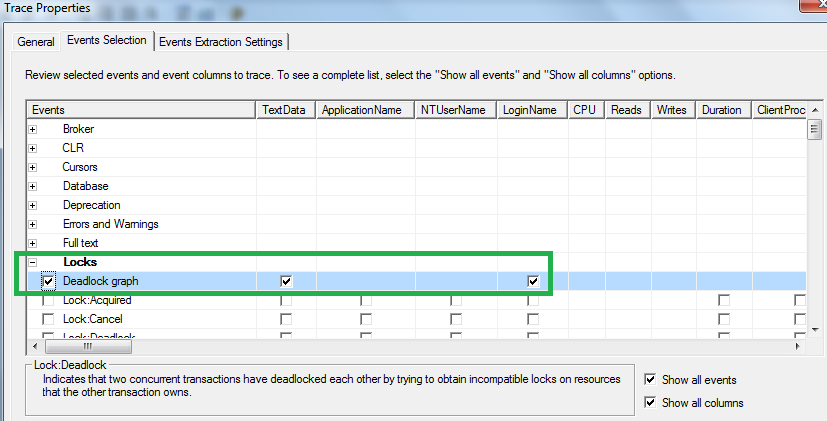
Events Selection – select Locks, select Deadlock graph
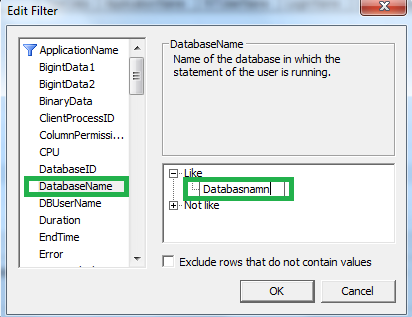
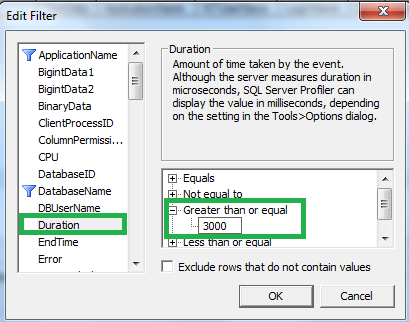
Select the Column Filters, select Database Name. Enter the database
Select Duration, 3000 (3 seconds) to not collect too much information
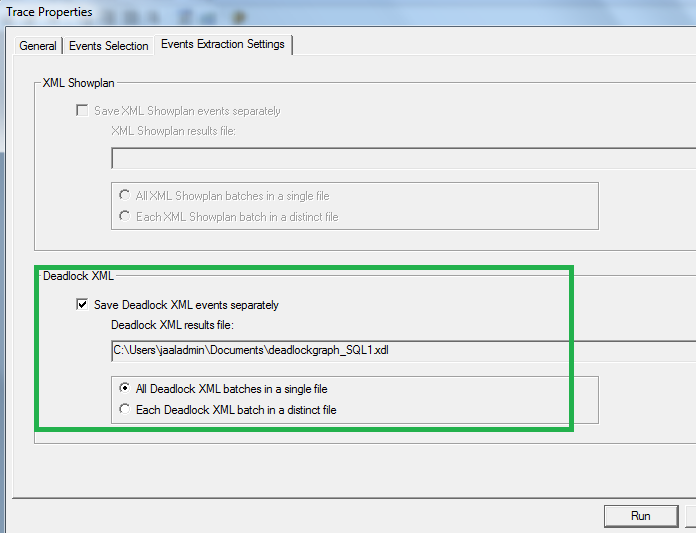
Events Extraction Settings – choose the path of Deadlock XML file
Analyzes, deadlock Chain between the SPID 94 and SPID 56
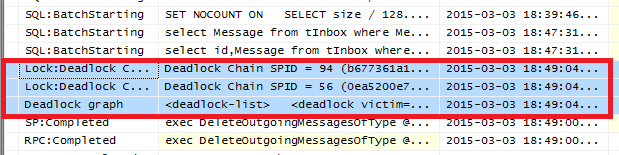
Mark Deadlock graph to display the graph below

Analyze the processes further in Deadlock XML Events with XML Notepad, available for download.
Visual Studio also works well.
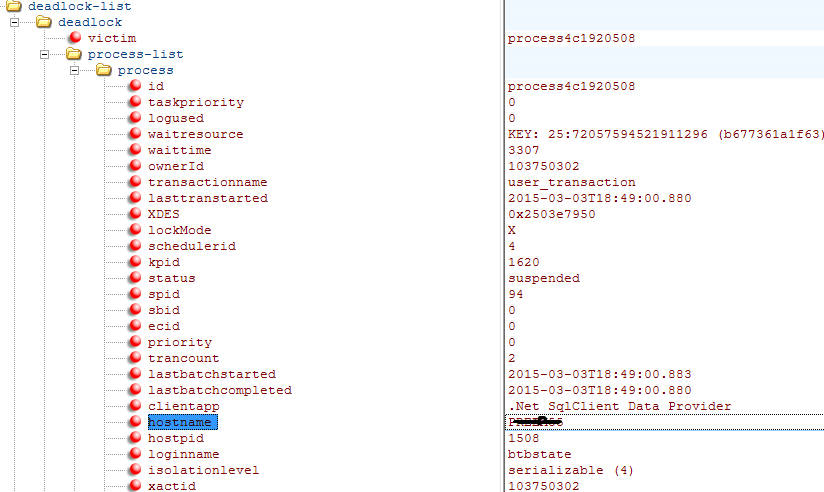
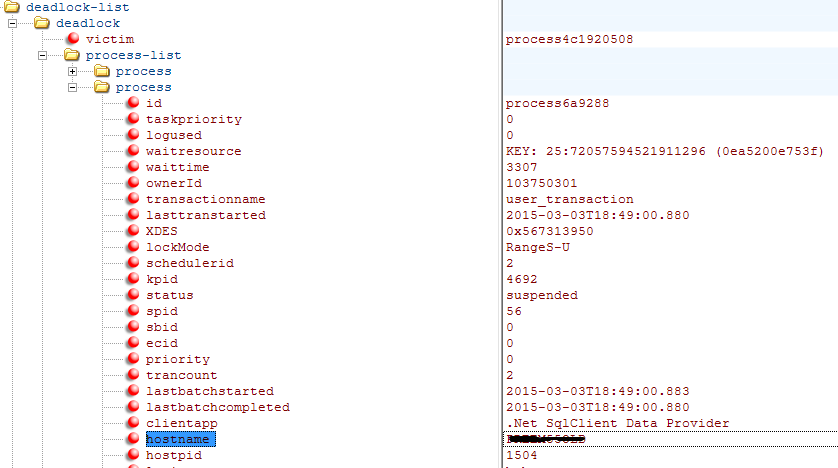
Using SQL Server Profiler trace and deadlock graph, we could identify that there were two processes that gave rise to deadlock events. The reason no rollback was performed due to the SPID 94 from ServerX and SPID 56 from ServerX was that they performed the same transaction. The customer had previously migrated application to a new server and either had then forgotten to disable part of the application on the old server or someone turned it on by mistake. After the customer shut down the old server the deadlock events ceased.