I ran into a problem today, while setting up SQL Server replication in a multi…
I have been troubleshoothing a SQL Server performance problem for a customer the last couple of days, in a performance test setup. We were not getting the result that we exepected, and we where not able to max out the CPU’s. The problem seemed to come from massive compiles (Not recompiles, atleast not as reported from perfmon and Profiler). This in its turn caused COMPILE locks that slowed everything down. We tracked it down step by step, and in the end we suspected that it had something to do with SET options. So I thought I share with you how we managed to prove that the SET options where the cause. The problem is that you can only have one copy of any given query plan in the cache at one time (except if you have one parallell and one serial), so looking at the plan in the cache only gives you what it looks like right now, not what it was before the last (re)compile.
What we did was the following:
1. Locate the problem sp/trigger/function by running SQL Profiler looking for SP:CahceInsert. This will give you a list of the statements that are (re)compiling
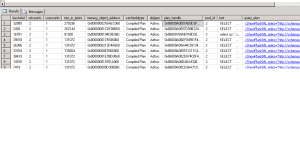
2. Run this query to locate the query plan currently in your cache for the particular query you are having problems with
3. Find the plan in the list, and copy its plan_handle Look at the attributes of the query plan with the following code:
select *fromsys.dm_exec_plan_attributes(your_plan_handle ) You should get output similar to this:
Save the results.
4. Wait a little bit, and repeat step 2 and 3 Compare the output to the output you got from step 3 last time. With some luck, you will catch the new plan after a recompile, and will then be able to pinpoint if there have been a change in the set_options value in the output from step 3. It they are different between the 2 runs, you have found the problem! The solution to the problem is to make sure that you always use the same SET options for all clients and applications, and not to change SET options in the code. I should also add that you could have additional issues, such as the “user_id” value. A value of -2 indicates that the query does not depend on implicit name resolution (you have been qualifying all objects with owner, such as “dbo.tablename” instead of just “tablename”) and can be shared among different users. Any other value represents the user ID of the user submitting the query in the database, requiring a compile the next time a different user runs the same query.
If you need help with optimizing SQL Server in any way, dont hesitate to contact us!


